


Fed liquidity: the Treasury's account weighs and reverse repos are empty
The Fed's balance sheet, the Treasury's account and reverse repos shape the liquidity available to markets. Where they stood at the end of October 2026, based on official figures.
Some investors follow a simple measure of dollar liquidity closely: the Federal Reserve's balance sheet, minus the cash the US Treasury holds in its account at the Fed, minus the sums money market funds place with the Fed each night. It is not an official Fed statistic, but each of its three components is.
Three figures, one subtraction
- The Fed's balance sheet, in other words its total assets: $6,753.6bn on 21 October 20261.
- The Treasury's account at the Fed (Treasury General Account, TGA): $952.0bn on 21 October2. When the Treasury builds up cash there, it takes that money out of the banking system.
- Reverse repos: $0.2bn on 21 October3. This is the money that money market funds lend to the Fed overnight.
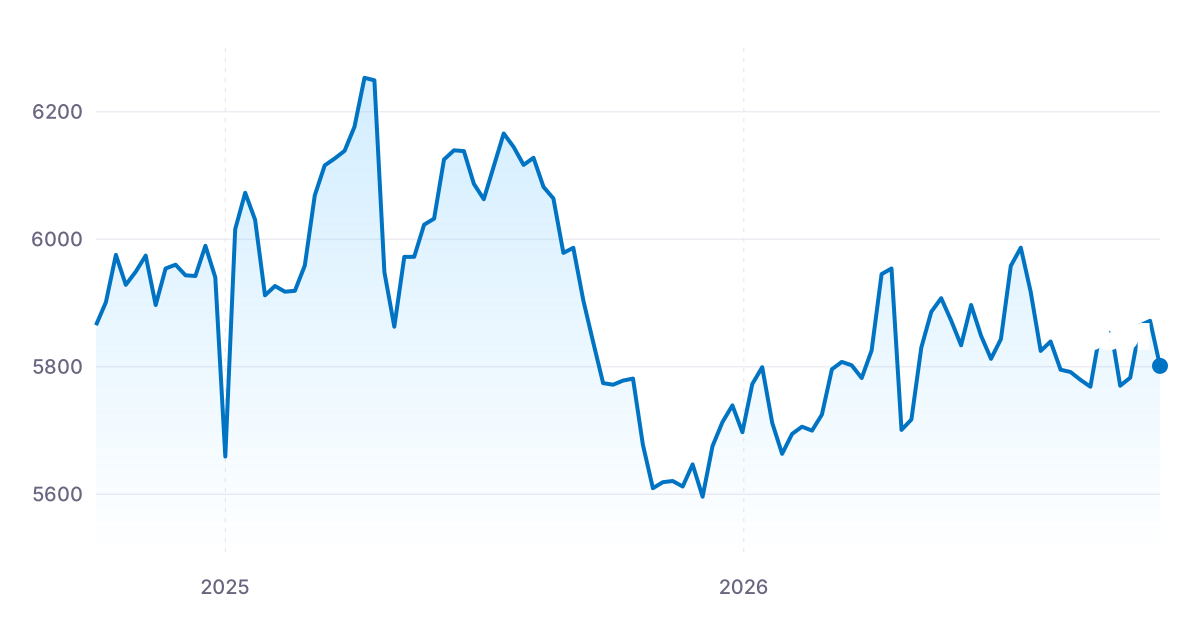
The calculation gives $5,801.4bn on 21 October 2026 (6,753.6 − 952.0 − 0.2, CentraFIN's calculation from the three series).
What has changed in a year
On 22 October 2025 the same measure stood at $5,677.5bn123. Three movements explain the difference.
The Fed's balance sheet is growing again. It has gone from $6,589.5bn a year ago to $6,753.6bn1. The Fed buys Treasury bills when needed to keep bank reserves ample, and reinvests the repayments on its agency securities in Treasury bills. Its September minutes show that these reserve management purchases have been paused, with reserves staying in a range judged ample4.
Reverse repos are empty. They stood above $383bn at the start of October 2024; today they are close to zero3. For a long time this cushion absorbed the movements in the Treasury's account. It is no longer there: when the Treasury fills its account, the money now comes straight out of banks' reserves.
The Treasury's account remains high. At $952.0bn, it is above its level of a year ago, $908.0bn2.
The week from 14 to 21 October
The Treasury's account rose by $68.6bn in a week, from $883.4bn to $952.0bn2. The Fed's balance sheet, by contrast, barely moved1. The net liquidity measure therefore fell from $5,872.1bn to $5,801.4bn (CentraFIN's calculation).
Over two years, its peak came on 9 April 2025, at $6,253.3bn, when the Treasury's account had fallen to $306.0bn2. Its low came on 3 December 2025, at $5,596.1bn.
Why this measure is followed
Banks' reserves are the raw material of the money market: they are what banks use to lend to one another and to finance other participants. When they fall, money available for investment becomes scarcer and dearer. That is why some investors in risk assets, crypto included, look at this subtraction every week.
The next dates
The Fed publishes its balance sheet every Thursday in its H.4.1 release5: the next ones come out on 29 October, 5 November and 12 November6. The Federal Open Market Committee meets on 27 and 28 October; our article on what the Fed has to decide takes stock ahead of the decision.
Sources
- FRED, total assets of the Federal Reserve (WALCL), in millions of dollars. ↩
- FRED, Treasury General Account at the Fed (WTREGEN), in millions of dollars. ↩
- FRED, Fed reverse repos (RRPONTSYD), in billions of dollars. ↩
- Federal Reserve, minutes of the FOMC meeting of 15 and 16 September 2026, published on 7 October 2026. ↩
- Federal Reserve, H.4.1 release. ↩
- FRED, economic release calendar. ↩