


Fed liquidity: the Treasury's account weighs as reverse repos run dry
The Fed's balance sheet, the Treasury's account, and reverse repos shape the liquidity available to markets. Where they stood at the end of October 2026, based on official data.
Some investors keep a close eye on a simple measure of dollar liquidity: the Federal Reserve's balance sheet, minus the cash the U.S. Treasury keeps in its account at the Fed, minus the money that money market funds park at the Fed overnight. It is not an official Fed statistic, but each of its three components is.
Three numbers, one subtraction
- The Fed's balance sheet, that is, its total assets: $6,753.6 billion on October 21, 20261.
- The Treasury's account at the Fed (Treasury General Account, TGA): $952.0 billion on October 212. When the Treasury builds up cash there, it pulls that money out of the banking system.
- Reverse repos: $0.2 billion on October 213. This is the money that money market funds lend to the Fed overnight.
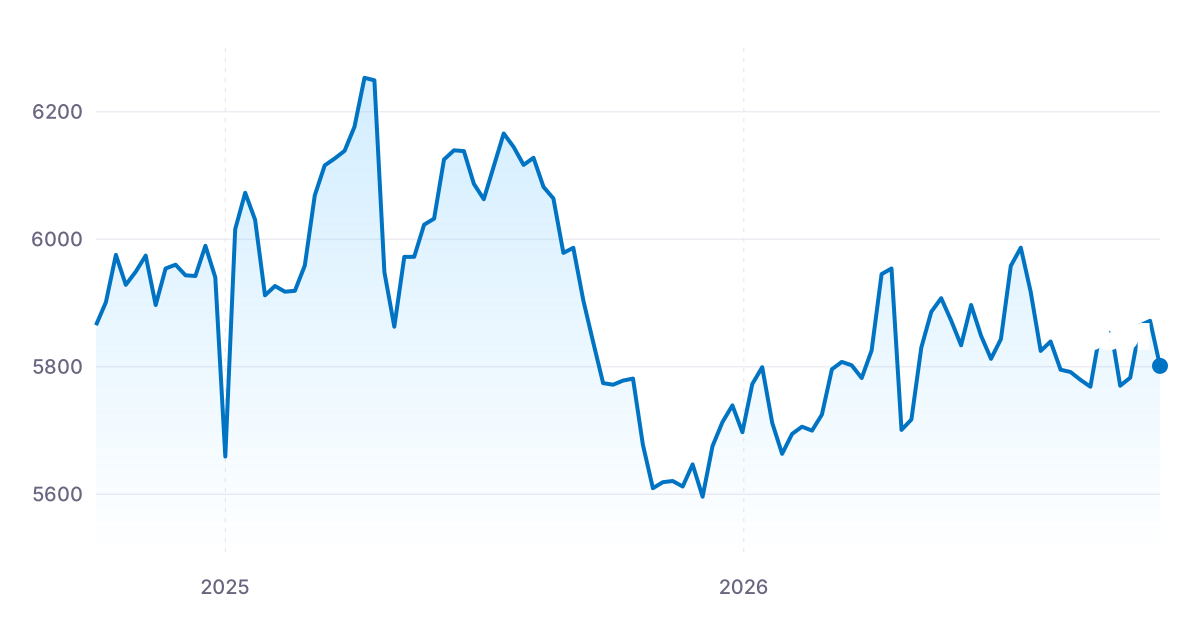
The calculation comes to $5,801.4 billion on October 21, 2026 (6,753.6 − 952.0 − 0.2, CentraFIN's calculation from the three series).
What changed in a year
On October 22, 2025, the same measure stood at $5,677.5 billion123. Three shifts explain the difference.
The Fed's balance sheet is growing again. It went from $6,589.5 billion a year ago to $6,753.6 billion1. The Fed buys Treasury bills as needed to keep bank reserves ample, and reinvests the principal payments on its agency securities into Treasury bills. Its September minutes indicate that these reserve management purchases have been paused, with reserves remaining in a range judged ample4.
Reverse repos have run dry. They topped $383 billion in early October 2024; today they are close to zero3. For a long time, this cushion absorbed the swings in the Treasury's account. It is gone: when the Treasury fills its account, the money now comes straight out of bank reserves.
The Treasury's account remains high. At $952.0 billion, it is above its level of a year ago, $908.0 billion2.
The week of October 14 to 21
The Treasury's account rose by $68.6 billion in one week, from $883.4 billion to $952.0 billion2. The Fed's balance sheet, meanwhile, barely moved1. The net liquidity measure therefore fell from $5,872.1 billion to $5,801.4 billion (CentraFIN's calculation).
Over two years, its high came on April 9, 2025, at $6,253.3 billion, when the Treasury's account had dropped to $306.0 billion2. Its low came on December 3, 2025, at $5,596.1 billion.
Why investors track this measure
Bank reserves are the raw material of the money market: banks use them to lend to one another and to fund other players. When reserves fall, money available for investment becomes scarcer and more expensive. That is why some investors in risk assets, crypto included, check this subtraction every week.
What's next
The Fed publishes its balance sheet every Thursday in its H.4.1 release5: the next ones are due October 29, November 5, and November 126. The Federal Open Market Committee meets October 27 and 28; our article on what the Fed has to decide lays out where things stand ahead of the decision.
Sources
- FRED, total assets of the Federal Reserve (WALCL), in millions of dollars. ↩
- FRED, Treasury General Account at the Fed (WTREGEN), in millions of dollars. ↩
- FRED, Fed reverse repurchase agreements (RRPONTSYD), in billions of dollars. ↩
- Federal Reserve, minutes of the FOMC meeting of September 15-16, 2026, released October 7, 2026. ↩
- Federal Reserve, H.4.1 release. ↩
- FRED, economic release calendar. ↩